Fraud Facts
April 10, 2017 by Jarred Berman
The Association of Certified Fraud Examiners (herein referred to as ACFE) publishes a report known as Report to the Nations every two years since 1996. This report is a summary of a detailed analysis of actual cases worked on in the most recent years by Certified Fraud Examiners (CFEs). The report presents data on the cost of occupational fraud, the perpetrators, the victims, and the various methods used to commit these crimes.
Outlined below are a few statistics you might find interesting. The source information for this blog can be found at www.acfe.com and in the report, “Report to the Nations” issued in 2016.
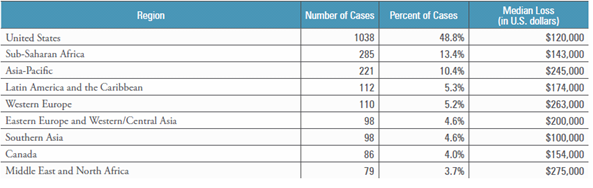
Geographical Location of Victim Organizations: The graph below shows that the US had the highest percentage of cases analyzed but the highest loss occurred in the Middle East and North Africa.
Scheme Types in the United States: The graph below shows billing and corruption schemes are the most common types of fraud occurring in the United States.

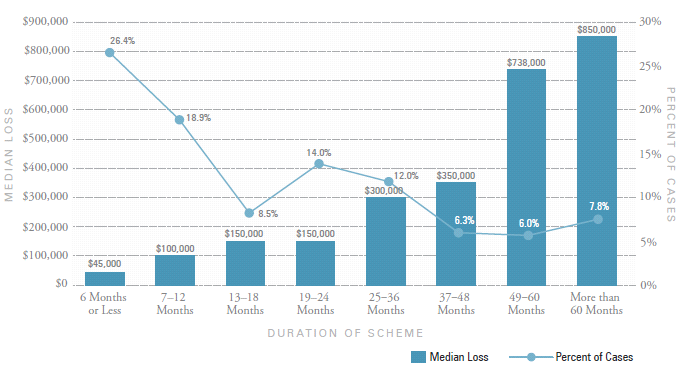
Frequency vs. Median Loss based on duration of the fraud: This graph shows that as time went on and the fraud was undetected, the median loss increased. However, fraud that lasted 6 months or less were the most common.
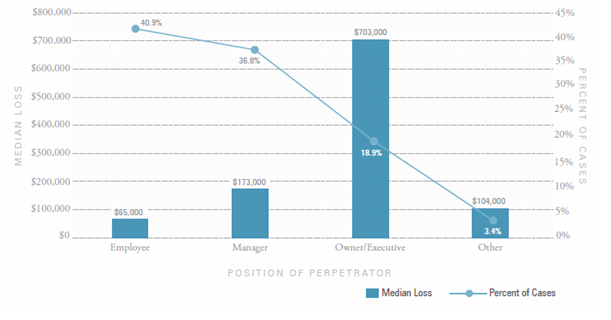
One of the most interesting parts of fraud examinations is finding out who committed the act. Here are some statistics on the perpetrators of frauds.
The graph below shows that employees commit the most fraud but are usually lowest in dollar amount losses. Owners/Executives usually commit fraud less often but when they do, they are much larger in dollar amount losses.
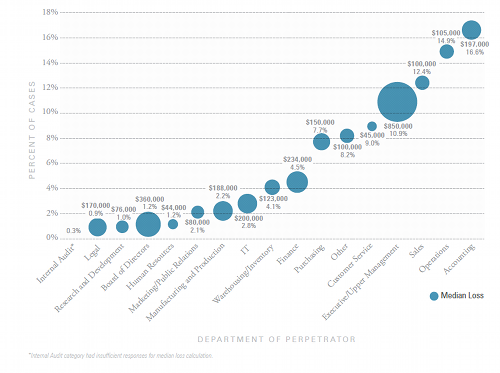
The graph below shows that most fraud is bound to happen in the operations or accounting departments of organizations.
Please reach out to us to see how we can help your company stay safe from fraud, both internal and external.
Category: Small Business
Tags: accounting, bookkeeping, fraud